Abstract
The distribution of dryland trees and their density, cover, size, mass and carbon content are not well known at sub-continental to continental scales This information is important for ecological protection, carbon accounting, climate mitigation and restoration efforts of dryland ecosystemsWe assessed more than 9.9 billion trees derived from more than 300,000 satellite images, covering semi-arid sub-Saharan Africa north of the Equator. We attributed wood, foliage and root carbon to every tree in the 0–1,000 mm year−1 rainfall zone by coupling field data machine learning satellite data and high-performance computing. Average carbon stocks of individual trees ranged from 0.54 Mg C ha−1 and 63 kg C tree−1 in the arid zone to 3.7 Mg C ha−1 and 98 kg tree−1 in the sub-humid zone. Overall, we estimated the total carbon for our study area to be 0.84 (±19.8%) Pg C. Comparisons with 14 previous TRENDY numerical simulation studies or our area found that the density and carbon stocks of scattered trees have been underestimated by three models and overestimated by 11 models, respectively. This benchmarking can help understand the carbon cycle and address concerns about land degradation We make available a linked database of wood mass, foliage mass, root mass and carbon stock of each tree for scientists, policymakers, dryland-restoration practitioners and farmers, who can use it to estimate farmland tree carbon stocks from tablets or laptops.
Main
Improved knowledge of dryland trees, defined here as having a green crown area >3 m2 with an associated shadow , is essential to understand their roles in local livelihoods, economies, ecosystems, the global carbon cycle and the climate system in general. Basic information about the distribution of dryland trees and their density, cover, size, mass and carbon content are not well known. This knowledge is required for understanding the functional traits of trees in relation to water resources with changes in climate, predicted increase in aridity and the number and duration of drought events The sources of information used to estimate carbon stocks in drylands include field surveys at plot scale; ecosystem models ; and low-resolution, moderate-resolution and high-resolution satellite images which are used to infer bulk properties such as averages of tree cover, dry masses and carbon density per unit area at a much coarser spatial scale than individual trees.
Although most emphasis is put on the development of advanced monitoring techniques for forested ecosystems, none of these sources combine wide/total coverage and representation of each individual tree. Reaching this level of detail is critical for dryland monitoring and management because dryland trees grow isolated and in highly variable size and density. Most current studies producing or using areal averages of tree cover, wood mass or carbon stocks in drylands are either at the very local level or the information for drylands is derived from global maps , which are rarely trained and validated in drylands and often apply the same method on both forests and dryland vegetation Although national tree inventories exist for few dryland countries, the amount of labour required and their uncertainty are high. As a result, all existing assessments on dryland carbon stocks are highly uncertain, very difficult to validate and do not provide the means for a detailed characterization at the level of individual trees Furthermore, the contribution of different dry-mass components—wood, foliage and root mass—to the overall carbon stock is unknown at large scales.
At the same time, it remains unknown whether ecosystem models quantify the right amount of carbon and the lack of validation of global models or maps in dry areas fuels narratives of possible underestimation or overestimation of carbon stocks of drylands and their role in accelerating or mitigating climate change The missing information on trees at the level of individuals is decisive for improved management of woody resources in drylands: to accurately monitor deforestation spurred by clearing of trees for cropping, mining, infrastructure and urban development Furthermore, accurate monitoring of the tree resource at the level of individual trees is instrumental for tree-planting initiatives, for reporting the correct number of trees and carbon stocks for national reporting schemes, such as the Paris Agreement, or to have a reliable system that allows payments for environmental services to farmers and villages. Although deforestation and afforestation areas can be accurately mapped using current methods and data in forest ecosystems, no monitoring system exists for trees outside forests and their carbon pools
At present, large amounts of funding are being allocated to dryland-restoration activities and the monitoring of success or failure is based on local inventories lacking large-scale assessments of survival rates of planted trees. The Great Green Wall of the Sahara and the Sahel initiative has recently been subject to renewed interest and increased investments This initiative was conceived to address the increasing challenges of desertification and drought, food insecurity and poverty in the wake of climate change. Yet the tracking of projects and their successfulness remains a great challenge, as no monitoring system is in place. Equally important, large-scale monitoring of single trees will create a foundation for establishing improved knowledge on the functional traits of dryland trees, such as survival, growth and mortality, controlled by the complex interplay between biotic and abiotic factors Afforestation initiatives should also be rooted in a solid ecological understanding of the local environment to avoid causing water shortages for small-holder farming systems
The combined use of very-high-resolution satellite images and artificial intelligence made it possible to identify isolated trees and map their crown area at large scales, covering the western Sahara–Sahel–Sudan areas This approach of mapping individual trees has been extended to a 7.5-times-larger area covering the drylands across Africa, from the Atlantic Ocean to the Red Sea from 9.5° N to 24° N latitude between the 0 and 1,000 mm year−1 isohyets, using 326,523 satellite images at a 50-cm spatial resolution, and coupled with machine learning to map 9.9 billion trees . The large-scale mapping of individual tree crowns provides an unprecedented opportunity to apply allometric equations to estimate carbon stocks derived from foliage, wood and root dry masses at local scales to large regions, here close to 10,000,000 km2 . We take this step to assess the woody carbon pool by adding up tree-by-tree values, calculated using allometric equations to predict foliage, wood and root dry masses from crown area multiplied by the average carbon concentration (0.47). These allometric equations were established by destructive sampling of trees from 26, 27 and 5 species, respectively, selected within a rainfall gradient from 150 to 800 mm year−1. Comparisons with allometric equations established in wetter tropical areas ensure applicability of these equations to wetter zones, at least up to 1,000 mm year−1 rainfall We estimated the combined uncertainty from the allometric equations and the tree crown detection to be ±19.8%.
Wood, foliage and root carbon of 9,947,310,221 trees with crown area > <p>3 m2 across 9.7 million km2 were mapped.
Wood, foliage and root carbon of 9,947,310,221 trees with crown area >3 m2 across 9.7 million km2 were mapped.

a, Our study covered the southern Sahara, the Sahel and the northern Sudanian zone of Africa and showed the aggregated carbon density (foliage + wood + root) per hectare for 9,947,310,221 tree crowns from the 0–1,000 mm year−1 mean precipitation area. The isohyets mark the 150, 300, 600 and 1,000 mm year−1 rainfall zones (from north to south). b, Example showing the woody carbon stock of each single tree for an agroforestry area in Senegal. c, Mean tree carbon density at the 5th, 25th, 75th and 95th percentiles along the rainfall gradient for wood, foliage and root carbon. d, Mean carbon stock of individual trees at the 5th, 10th, 25th, 75th, 90th and 95th percentiles along the rainfall gradient. Our definition of a tree is a green leaf crown >3 m2 with an associated shadow
Carbon Stocks At The Tree Level
We applied a deep-learning-based tree mapping on a large number of satellite images and measured 9,947,310,221 tree crowns: all woody plants with a shadow and a crown area >3 m2 from the hyper-arid (0–150 mm year−1), arid (150–300 mm year−1), semi-arid (300–600 mm year−1) and dry sub-humid (600–1,000 mm year−1) rainfall zones of tropical Africa north of the Equator and south of the Sahara The average carbon stock of a single tree is 51 kg C in the hyper-arid, 63 kg C in the arid, 72 kg C in the semi-arid and 98 kg C in the sub-humid zone. The individual tree information was projected to the area by calculating the carbon density in Mg C ha−1, which was on average 0.03 Mg C ha−1 in the hyper-arid, 0.54 Mg C ha−1 in the arid, 1.54 Mg C ha−1 in the semi-arid and 3.73 Mg C ha−1 in the sub-humid zone. Although foliage mass has a small overall fraction of the total dry mass (3%), it is an important variable for quantification of browse potential and serves as a proxy for other ecosystem processes, such as transpiration, photosynthesis and nutrient cycling. The proportion of root mass is on average 15–20% of the total mass.
Current Carbon Map And Model Comparisons
We compared our aboveground carbon-density maps (foliage + wood) derived from individual trees with current state-of-the-art maps available at moderate spatial resolutions of 30–1,000 m. The temporal dynamics were assessed by low-frequency passive microwaves (L-VOD) which has emerged as a tool for the assessment of carbon stock dynamics at the 25 × 25-km spatial scale Moreover, we compared carbon-density maps and dynamics with dynamic ecosystem models from the TRENDY database with a 50 × 50-km grid cell size. None of these maps were designed specifically for drylands; most dynamic ecosystem models and satellite-based models are developed and trained for forest ecosystems and, in the case of the TRENDY models, used meteorological forcings and prescribed vegetation maps that contain further uncertainties for comparative purposes.
Fig. 2: Comparisons between current aboveground carbon-density maps and our estimations derived from 9.9 billion trees.

a, Aboveground carbon density from state-of-the-art maps using satellite data. Tree carbon from this study is derived from wood + foliage carbon plotted with ±1 standard deviation in the grey zone. b, Aboveground carbon stocks aggregated over the 0–1,000 mm year−1 rainfall zone. Our estimations (grey colour) of 0.68 Pg are wood + foliage carbon. The combined uncertainty from neural net area mapping, tree crown omission and commission errors, and allometric conversion of tree crowns into tree wood, foliage and root carbon was ±19.8%. c, Vegetation carbon density from the mean of 14 TRENDY dynamic ecosystem models and data from six individual TRENDY models for aboveground and belowground carbon are compared with our tree carbon with aboveground herbaceous carbon added from passive microwaves. d, Aboveground carbon density from the LPJ-GUESS model, selected here as it uses trees outside the prescribed forest fraction, and our estimations are compared along the rainfall gradient. L-VOD was converted to carbon density using coefficients from a linear correlation with our map. Aboveground herbaceous carbon was derived from ref. . The sample size for the 0–1,000 mm year−1 rainfall zone was 9,947,310,221 tree crowns >3 m2.
Existing carbon-density maps compare differently with our assessment based on individual trees and there is little spatial agreement among the maps. Notably, although areas of scattered trees having a relatively low carbon density are largely mapped as zero carbon in previous maps except for ref., areas of denser tree cover and some areas typically without trees, such as wetlands, irrigated croplands and desert mountains, have considerably higher values than our assessment. This leads to an overall higher carbon stock of the area compared with our results. Although we do not map herbaceous vegetation in our study, the tree cover we map can be used to disaggregate herbaceous vegetation from trees .
At regional scales, dynamic ecosystem model vegetation carbon shows a considerable variability, but the mean follows our estimates of herbaceous, wood, foliage and root carbon along the rainfall gradient Notably, whereas previous studies assumed that ecosystem models underestimated dryland carbon stocks, our results show overall higher values from the model outputs as compared with the assessment based on individual trees, although large variations between models exist. Only considering aboveground carbon, the example of LPJ-GUESS shows slightly lower values than our assessment up to about 800 mm year−1 rainfall .
Both ecosystem models and previous satellite-based carbon maps diverge markedly from our results beyond 700–800 mm year−1 rainfall. All other maps assume a continuous increase beyond this rainfall zone, yet our results reach a plateau at 800 mm year−1 and no further increase in carbon is observed with higher rainfall up to 1,000 mm year−1. We acknowledge that the uncertainty of our results increases with denser canopy cover and that we miss all understory vegetation. However, statistical evaluations of the rainfall–tree density relationship from our data indicate that neither carbon stocks per treenor tree cover further increased between 800 and 1,000 mm year−1 rainfall Trees with crown area <50 m2 make up 88% of the total number of trees, whereas trees in the semi-arid and sub-humid zones constitute 90% of the total carbon in our study
Fig. 3: Precipitation, tree carbon and crown area.

a, The tree carbon probability density function computed along the rainfall gradient of the study from the hyper-arid (0–150 mm year−1), arid (150–300 mm year−1), semi-arid (300–600 mm year−1) and dry sub-humid (600–1,000 mm year−1) rainfall zones. The percentage area of each semi-arid zone is shown in blue and the percentage of total carbon in red. The increasing tree carbon probability function shows the importance of precipitation for tree carbon in semi-arid regions. Most tree carbon is found in the semi-arid (26%) and dry sub-humid zones (64%), which represent only 30% of the area in our study. The per cent carbon density contribution by rainfall zones is linearly related to the tree carbon density (Mg C ha−1) reported in Fig. by a factor of 2.5. b, A total of 88.4% of our mapped trees had crown areas <50 m2. The average tree crown area in the 0–150 mm year−1 zone was 15.1 m2, for the 150–300 mm year−1 zone it was 18.4 m2, for the 300–600 mm year−1 zone it was 20.9 m2 and for the 600–1,000 mm year−1 zone it was 28.1 m2. Only 11.6% of our mapped trees had crown areas >50 m2 and less than 0.6% had crown areas >200 m2.
Application At The Tree Level
The comparison with dynamic global vegetation models and existing biomass maps shows some similar patterns at coarse scale, yet none of these maps can be used to derive information at the level of individual trees needed to support policymakers and decision-makers. For this reason, we introduce a viewer which is built on Mapbox and OpenStreetMap, and can be accessed online by everyone and from anywhere. The viewer includes all 9.9 billion trees as objects, and the wood, foliage and root mass can be accessed individually for each of them. As an example, we show the area of Widou Thiengoly, an area in Senegal in which tree planting for the Great Green Wall has been promoted over the past decades Although previous assessments on the success of tree plantations were based on narratives, visual interpretations or site visits, the viewer provides an unbiased tool for evaluating success and failure of initiatives, as well as quantifying the carbon stocks gained by each planted tree or lost by each removed/dead tree. The example shown in Fig. illustrates that high-density plantations in this arid region reach carbon-density values of about 5 Mg C ha−1, but the survival rate of planted trees has been a long-lasting concern that needs to be carefully monitored to be able to assess the efficacy of Sahelian tree-planting programmes.
Fig. 4: Different components of the viewer.
This example shows Widou Thiengoly in semi-arid Senegal surrounded by tree plantations, which are partly related to a Great Green Wall project aiming to increase tree density and improve livelihoods in the Sahel. a, Tree crown segmentations from the neural net mapping. b, Wood, foliage and root carbon calculated for each tree c, Carbon density per hectare aggregated from carbon stocks of single trees to the hectare scale. d, Our viewer includes all information from a to c. This online tool provides information on crown area; foliage, wood and root carbon of single trees; and aggregates carbon to the hectare scale. These data can be accessed by policymakers and stakeholders to monitor areas of interest. The viewer can be accessed at
Another example shows an agroforestry region in Senegal, north of Khombole that has a relatively high density of trees, which has increased the carbon stocks of the region considerably. The example area shown in Fig.has almost doubled carbon density between 2002 and 2021
Fig. 5: Monitoring at the level of single trees from Khombole, Senegal.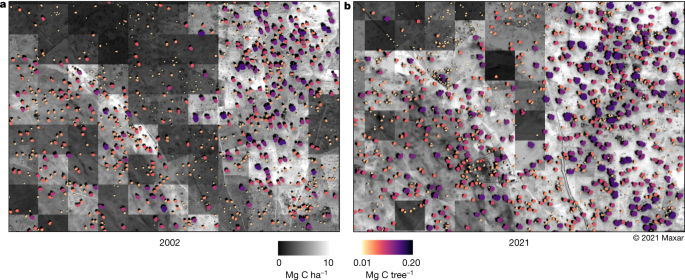
a,b, A 50-cm-scale image from 2002 (a) and a 50-cm-scale satellite image from 2021 (b) showing an agroforestry area at the same location. Tree cover has increased between 2002 and 2021 and the average carbon density of both areas was calculated and increased from 6 to 10 Mg ha−1. A large number of trees grow on farmlands, keeping the soils fertile and reducing the need for fallow periods. The greyscale of the background images indicates the carbon density per hectare, whereas the colour scale shows the carbon content of individual trees. This is a good example of the tree restoration monitoring potential in our study area.