More Than One Quarter Of Africa’s Tree
Image collaboration F. Reiner & M. Brandt; see Reiner, F., Brandt, M., Tong, X. et al. More than one quarter of Africa’s tree cover is found outside areas previously classified as forest. Nat Commun 14, 2258 (2023). https://doi.org/10.1038/s41467-023-37880-4
Abstract
The consistent monitoring of trees both inside and outside of forests is key to sustainable land management. Current monitoring systems either ignore trees outside forests or are too expensive to be applied consistently across countries on a repeated basis. Here we use the PlanetScope nanosatellite constellation, which delivers global very high-resolution daily imagery, to map both forest and non-forest tree cover for continental Africa using images from a single year. Our prototype map of 2019 (RMSE = 9.57%, bias = −6.9%). demonstrates that a precise assessment of all tree-based ecosystems is possible at continental scale, and reveals that 29% of tree cover is found outside areas previously classified as tree cover in state-of-the-art maps, such as in croplands and grassland. Such accurate mapping of tree cover down to the level of individual trees and consistent among countries has the potential to redefine land use impacts in non-forest landscapes, move beyond the need for forest definitions, and build the basis for natural climate solutions and tree-related studies.
Introduction
Forests and other tree-based ecosystems contribute to the removal of CO2 emissions, and are thus central to climate change mitigation strategies aiming to achieve net zero CO2 emissions targets. Accordingly, the Glasgow Pact from COP26, to which more than 100 countries are signatory, stresses the importance of halting and reversing global deforestation by 2030. In order to achieve success, actions to halt deforestation and forest degradation require the direct support from high-quality monitoring systems that deliver measurement, reporting, and verification (MRV) of forest area and change consistently and comparably among countries. However, tree losses do not only occur in dense high-carbon forests, but also in landscapes of scattered trees that do not form closed-canopy forests. Conversely, tree gains in these non-forest landscapes are often not perceived positively as they can contribute to destabilizing open ecosystems.
The United Nations Food and Agriculture Organization (FAO) provides relatively clear definitions for forests, but regroups remaining landscapes with trees into “other wooded land” and “other land”. These categories include a variety of tree-based systems, among them savannahs and woodlands, shrub- and bushlands, trees on agricultural land, and clustered trees in woodlots. The physical boundaries separating forest and non-forest are relatively clear in the Northern Hemisphere. However, many African landscapes are drylands, where trees outside forests are the major form of woody vegetation. Previous studies have found that, following the FAO definition, forests cover only 21.4% of Africa, with an additional 14.9% considered as “other wooded land”. The remaining 63.7% is classified as “other land”, which also includes agricultural plantations, agroforesty, urban trees, and a wide variety of tree complexes outside forests in agricultural lands. These trees outside forests play a vital role in ecological stability, local economies, livelihoods, and food security.
The quantitative assessment of trees in both forested and non-forested landscapes is crucial to reducing emissions from deforestation and forest degradation, as well as increasing sequestration through forest restoration, agroforestry, and other restoration interventions. Quantifying trees outside forests would also enable assessment of woody encroachment and the identification of areas threatened by increasing woody cover. However, ambiguous definitions, unclear MRV techniques that may differ from country to country, and scarce technical and financial resources in many developing countries limit the reliability and credibility of current approaches. Moreover, defining better classes to separate large trees, with high ecological and economic value, from shrubs would be an important improvement over current definitions. Similarly, for closed canopies the classification of forests by canopy height is desirable, both to ensure that small shrubs are not mapped as tree cover, and to differentiate between primary, secondary, or plantation forests. This requires the incorporation of canopy height datasets, such as satellite, aeroplane-, or UAV-based lidar measurements. Overall, the principal problem remains the consistent assessment of all tree and forest resources, across both countries and years.
Satellite data of moderate spatial resolution (10–30 m) are the prevailing data source for mapping and monitoring tree cover change at continental-to-global scales. However, the 10–30 m resolution does not allow the characterization of individual trees outside forests, although there have been attempts to map pixel fractional cover with methods such as spectral unmixing. Recent studies have shown that very high spatial resolution (0.5 m) satellite data and state-of-the-art machine learning techniques are able to map individual trees across large areas, which is one important requirement for accurate reporting schemes. Previous work used images from many commercial satellites, resulting in a temporal mixing of data across more than a decad. However, the use of data from different years and dates is problematic, not only because tree change information is obscured, but also because trees are not consistently mapped due to variations in phenology. Moreover, extending high-resolution tree mapping to continental or global scales is limited by technical challenges in data processing and storage. Furthermore, sub-metre imagery is prohibitively expensive for most non-governmental organizations to acquire and process data over large study areas. Finally, the lack of temporally consistent imagery makes it difficult to monitor fine-scale tree cover change caused by tree plantations, agroforestry, selective logging, deforestation, or woody encroachment. Overall, it is currently difficult to implement consistent assessments at continental scale and across years based on sub-metre satellite data, in spite of their high value. Therefore, a critical gap remains in the repeated mapping of forest and non-forest trees at high resolution in a consistent temporal window and at a continental level.
Here, we address these limitations by using high-resolution satellite imagery from a nano-satellite constellation, freely available for the tropics via Norway’s International Climate and Forest Initiative (NICFI) programme. Our major objective is to map all forest and non-forest trees at continental scale across Africa, and at a precision exceeding all previous attempts to map woody vegetation across large scales. We use a machine learning approach to segment tree canopy cover in 3 m PlanetScope satellite imagery across Africa, down to the level of individual scattered trees. We quantify the contribution of trees outside forests to total tree cover per country, and find that at the continental scale, 29% of all tree cover is found outside areas classified as forest in a current state-of-the-art map based on Sentinel-2 10 m imagery.
Results
A very high-resolution map of African tree cover
We used 3 m resolution satellite imagery from Planet Labs Inc to generate composites covering continental Africa in 2019. The raw images were provided by the PlanetScope constellation of nanosatellites, with 4-band scenes available globally at daily temporal resolution. We organized and mosaiced more than 230,000 satellite scenes in a grid of 1 × 1° tiles. The time window for each tile was inferred from the green vegetation phenology of the area (see Methods), such that tree leaf cover is maximized while grasses have passed their productivity peak. The availability of daily PlanetScope images was key to generating cloud-free images for a narrow time frame of a few weeks within a single year. In cloud-prone regions, the time window was extended progressively up to several months (see Methods). We then used a deep learning model trained with about 130,000 manual training samples to segment tree crown cover for all of Africa at 1 m resolution. We only labelled trees or groups of trees that were clearly identifiable as a woody plant with an associated shadow, which typically excludes bushes and shrubs below about 5 m (see Methods). We upsampled the images from 3 to 1 m to increase the model prediction performance by preserving the high quality of the manually delineated training samples. In croplands, savannahs and low-density woodlands, trees were mapped as individual crowns. Semi-dense and closed forests were mapped as closed canopies, with no separation of individual crowns.
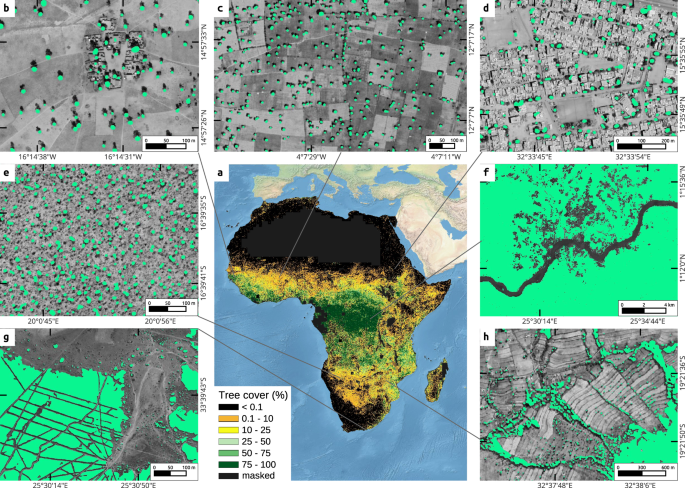
a Percentage tree cover, at 1 km spatial resolution; b–h examples of predicted tree cover overlaid on Google Maps satellite imagery (Imagery © 2022 CNES / Airbus, Landsat / Copernicus, Maxar Technologies, Map data ©2022), in: b a village in Senegal; c agricultural fields in Burkina Faso; d an urban environment in Khartoum, Sudan; e Miombo woodlands in Angola; f deforestation in the Democratic Republic of Congo (DRC); g Eucalyptus plantations in South Africa; h terrace farming in Zimbabwe.
To derive percent tree cover from the binary tree/no-tree map, we aggregated our results into 30 × 30 m grid cells. These cells were first grouped into non-forest areas with a maximum tree cover of 10% and 25% from our map, two widely used forest definition thresholds. Then, if canopy cover exceeded 25%, we considered the cell to be a forest, which we further grouped into different canopy heights using a spaceborne LiDAR based map from a previous study. Note that our results are not constrained by these definitions and, given the level of detail in the mapping, full flexibility exists for selecting thresholds and resolutions to apply, or to use different canopy height maps
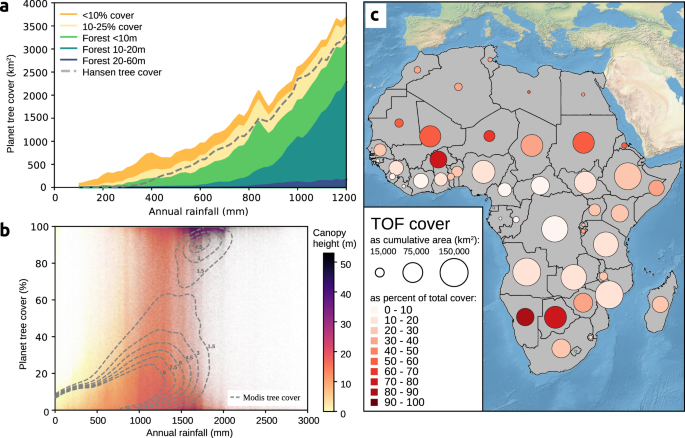
To analyze the distribution of trees across different climatic zones, we summed tree cover by annual rainfall. A previously published and widely used global tree cover map was added for comparison purposes We find that, at continental scale, the PlanetScope tree cover matches the global map for forests and even for areas of 10–25% tree cover, especially in higher rainfall areas, but the global map completely misses tree cover below 10%, which is the dominant form of tree cover in low rainfall areas. Across Africa, we show that 15.8% of tree cover is located in areas with less than 25% canopy cover, and 6.0% of the tree cover is in areas with less than 10% canopy cover. A total of 0.16% of tree cover is in hyper-arid areas (0–150 mm rainfall), 0.7% in arid areas (150–300 mm rainfall), 4.3% in semi-arid areas (300–600 mm), 27.5% in sub-humid areas (600–1200 mm), and 67.0% in humid areas (>1200 mm). Interestingly, a random sample of tree cover plotted against rainfall shows a homogeneous distribution of tree cover along the rainfall gradient without a gap at 60–80% tree cover, which is observed in the widely used MODIS tree cover and has previously been interpreted as a sign of alternative stable ecosystem states. The lack of such a gap in our tree cover map thus supports the argument by Hanan et al. that this was an artefact from the statistical processing of the MODIS tree cover map
a Total tree cover area by rainfall. Tree cover is classified into forest at different heights, and into two groups of trees outside forest (TOF) with canopy cover <10% and 10–25%, respectively. A current state-of-the-art global map is added for comparison. This figure highlights the regions below 1200 mm rainfall and the full map is shown in Supplementary b Tree cover vs. rainfall at 100 m resolution using a random sample of 10 million grids, with hue as the forest height and isolines overlaid for MODIS tree cover from 100 000 samples at 250 m, with isoline units as relative probability per rainfall and cover grid cell. c Contribution of trees outside forests (TOF) to total tree cover at country scale. We group trees in 30 × 30 m grids and define a cell as non-forest if the canopy cover is below 25%, and as forest, if it exceeded 25%. Tree cover is subsequently accumulated for each country.
Distribution of trees outside forests
We compared the total tree cover from non-forest areas (here defined as <25% tree cover) against the total tree cover for 45 African countries. Even though trees in non-forest areas contribute only a minor part to the total tree cover at continental scale at national level trees outside forests constitute more than 50% of all tree cover in nine countries namely Botswana, Burkina Faso, Eritrea, Libya, Mali, Namibia, Niger, Mauritania, and Sudan. This implies that previous moderate-resolution tree cover maps are of little use to quantify national woody resources for these countries.
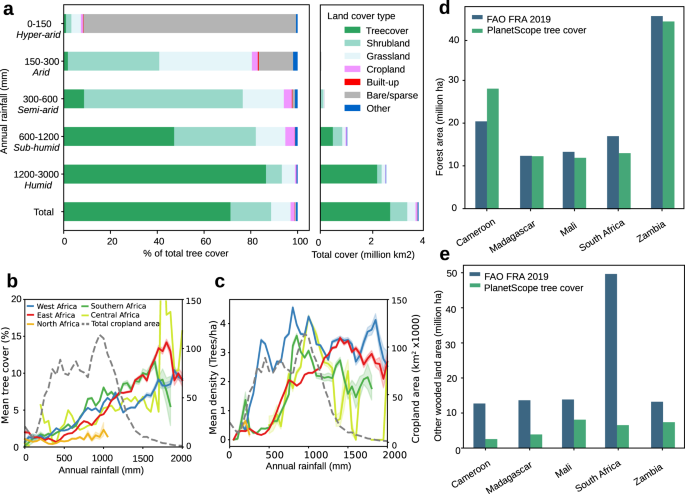
The very high resolution of our tree cover map was then used to quantify the proportion of tree cover found across land cover classes, by leveraging the 10 m resolution WorldCover land cover map Overall, across all rainfall regions, we find that 28.7% of tree cover is found outside of land classified as ‘tree cover’ according to WorldCover Additionally we show that for dryland regions (up to 1200 mm rainfall), the majority of tree cover is found in areas classified as shrublands, grasslands and deserts (‘bare/sparse’ category), with 90.9% of tree cover found in bare/sparse land cover for hyper-arid areas, 39.6% in grasslands and 39.0% in shrublands for arid areas, 67.9% in shrublands for semi-arid areas, and 34.9% in shrublands for sub-humid areas
a Distribution of mapped tree cover by land cover type and precipitation zone, with land cover classes from the Worldcover product See Supplementary Table for mean tree cover by land cover. b Distribution of non-forest trees on African croplands, showing mean tree cover and c mean tree density on croplands. The right-side y-axis is the total cropland area, and the shaded background of the lines represent the 95% confidence interval. See Supplementary for grasslands. d Reported tree cover compared to FAO statistics for ‘Forest’, defined as areas with >10% tree cover and e ‘other wooded land’ defined as areas with 5–10% tree cover, or >10% cover of trees, bushes, and shrubs.
At continental scale, while a relatively large amount of tree cover (~29%) is outside the ‘tree cover’ land cover class, only 1.7% of tree cover is found in croplands. However, for local communities in African drylands, many of the primary uses of cropland trees are food, fodder, shade, and fuel-wood, or their role in agroforestry systems Such cropland trees are usually widely spaced and can be individualized in our tree cover map. This lends itself to the analysis of the number, density, crown size, and distribution of trees on croplands. We assumed that all segmented objects on croplands are individual tree crowns, with a correction applied where objects with crown size >200 m2 are assumed to be tree clusters and considered as multiple trees of 200 m2. We found a total number of about 433 million trees on African croplands, with a mean tree density of 2.55 (±5.81) trees per hectare.
Dividing Africa into northern, western, eastern, central, and southern Africa we find that western Africa has the highest mean density of cropland trees across most of the rainfall gradient, although this pattern is not replicated in the mean tree cover. This suggests large numbers of smaller trees on western African croplands, especially in the rainfall regions of 300–1200 mm. As annual rainfall increases, there are different rainfall thresholds for each region at which cropland tree density suddenly rises, at about 250 mm for western Africa, 500 mm for eastern Africa, and 700 mm for central and southern Africa. A possible explanation may lie in the greater use for agroforestry of drought resistant Sahelian trees in western Africa, compared to eastern and southern Africa.
Comparison with FAO statistics and canopy height maps
We compared our numbers of area cover with the FAO statistics reported by each country. Here we group our results following the FAO definitions of “forest” and “other wooded land”, where “forest” is defined as areas >0.5 ha, with tree height above 5 m and a canopy cover of more than 10%; and “other wooded land” is defined as areas >0.5 ha, with tree height above 5 m and a canopy cover of 5–10%, or a combined cover of trees and shrubs above 10% . The category “other land with tree cover” was not considered because no statistics exist for most of the countries. Forest areas matched relatively well with our results for most countries: at continental scale, we map 7,519,197 km² as forest and the FAO reports 6,374,249 km2 for the year 2019. Interestingly, our results tend to map more areas as forest compared to the FAO statistics, which could be a result of different definitions of “forest”. For example, FAO “forest” includes forestry plantations but not tree crop plantations, but both are included in our map when mature. We map markedly fewer areas as “other wooded land” than reported by the FAO (1,830,553 km² as compared to 4,438,199 km2), likely because bushes and small shrubs are not included in our map.
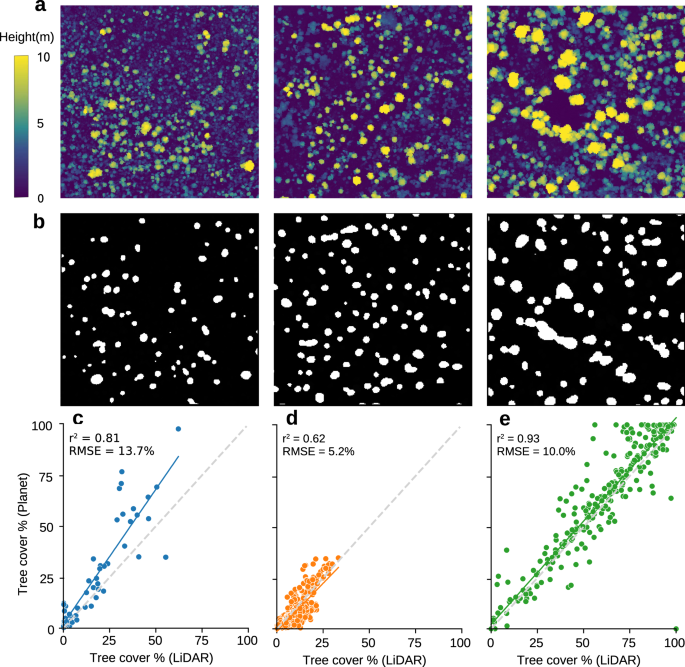
When comparing our tree cover statistics with those of the FAO, it is thus important to consider the tree height at which our method starts to map trees, as the FAO also includes shorter shrubland with a cover >10% in “other wooded land”. Here, we compared our results with canopy height models (CHM) from airborne LiDAR and UAV stereo photogrammetry from Senegal, DRC and Mozambique, and show that we typically do not map bushes, small shrubs and trees below 5–6 m with 178,750 isolated trees derived from sub-metre resolution optical imagery from the Sahel shows that isolated tree crowns above 30 m² were reliably mapped (less than 20% missed), while 44.2% of the crowns below this threshold were omitted . Therefore, our maps may be used to redefine the category of “other wooded land” by separating single scattered trees in areas of low tree cover from shrubs and bushes.
a Airborne LiDAR canopy height models for three scenes in Karingani Game Reserve, Mozambique. b Corresponding binary tree cover predictions from PlanetScope map. c–e Scatter plot between PlanetScope tree cover and CHM tree cover if a minimum tree height of 5–6 m is used for the CHM data for c 59 sample plots in Senegal, ranging from 2–15 ha size (5 m height threshold), d 400 random plots in Mozambique, each 50 ha size (6 m height threshold), e 400 random plots in DRC, each 50 ha size (6 m height threshold).


